
 tzukizy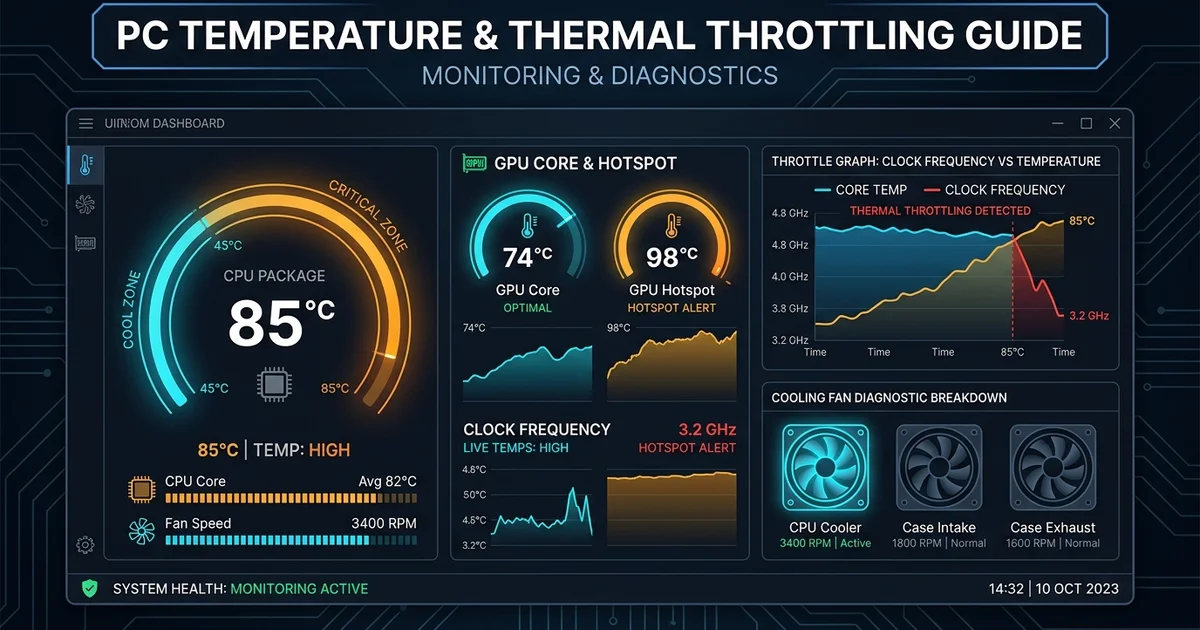
When your game runs smoothly for the first ten minutes and then suddenly collapses into stuttering, frame drops, and choppy audio, heat is almost always the culprit. Modern processors and graphics cards are designed to push themselves as hard as possible until they hit a thermal wall. Once temperatures cross safe thresholds, your hardware protects itself from physical damage by forcibly cutting its operating clock speeds. This self-preservation mechanism is called thermal throttling.
The problem is that Windows does not provide built-in CPU temperature readings out of the box in Task Manager. While Task Manager displays basic GPU temperature on the Performance tab, it leaves your processor's thermal state completely invisible. To accurately check PC temperature and figure out why your system is losing performance, you need the right diagnostic tools and a clear understanding of what those numbers actually mean.
The Difference Between Normal Heat and Thermal Throttling
Silicon running under heavy computation produces heat. That is physics. Seeing your CPU run at 75°C while loading a demanding game or compiling code does not mean your computer is damaged. However, there is a sharp boundary between normal operating heat and thermal throttling.
Every modern processor features an internal limit known as TjMax (Thermal Junction Maximum). When the silicon reaches this internal ceiling, the motherboard's voltage regulator modules (VRMs) and the processor's internal firmware immediately dial back voltage and drop core frequencies—sometimes from 4.8 GHz down to 1.2 GHz in a fraction of a second. This sudden drop in computing throughput causes violent frame pacing spikes.
If you have already tried adjusting in-game settings to increase FPS in Roblox or other PC titles but performance still degrades over time, you are dealing with a thermal dissipation issue rather than a pure software limitation.
Safe Hardware Temperature Thresholds
Different processor architectures and graphics chips have different thermal ceilings. What counts as overheating on an older quad-core desktop is completely normal on a modern thin-and-light gaming laptop.
| Component & Architecture | Normal Idle | Gaming / Sustained Load | Thermal Throttle Point | Critical Shutdown |
|---|---|---|---|---|
| Intel Core (12th/13th/14th Gen) | 35°C – 45°C | 68°C – 85°C | 100°C (TjMax) | 105°C |
| AMD Ryzen 7000 / 9000 Series | 40°C – 50°C | 70°C – 90°C | 95°C (Target Max) | 100°C |
| AMD Ryzen 3000 / 5000 Series | 35°C – 45°C | 65°C – 80°C | 90°C | 95°C |
| NVIDIA GeForce RTX (Core) | 30°C – 42°C | 65°C – 78°C | 83°C – 88°C | 90°C |
| NVIDIA GeForce RTX (Hotspot) | 40°C – 50°C | 78°C – 92°C | 105°C | 110°C |
| AMD Radeon RX Series (Core) | 32°C – 45°C | 62°C – 75°C | 85°C – 90°C | 95°C |
| Gaming Laptops (CPU) | 45°C – 55°C | 82°C – 93°C | 95°C – 100°C | 105°C |
If your desktop CPU stays below 80°C and your GPU stays below 75°C while gaming, thermal throttling is not occurring. If your readings sit constantly at 95°C–100°C and your clock speeds drop, your hardware is aggressively throttling.
How to Check Your PC Temperature Accurately
You cannot diagnose a thermal problem without accurate, real-time sensor polling. Here are the two most reliable, lightweight, and trustworthy monitoring tools available on Windows.
1. HWiNFO64 (The Gold Standard for Detailed Diagnostics)
HWiNFO64 is the most comprehensive hardware diagnostic tool for Windows. It polls every thermal diode on your motherboard, CPU cores, memory modules, and GPU silicon.
- Download HWiNFO64 from its official website (the portable ZIP version requires no installation).
- Launch the application and select Sensors-only, then click Start.
- Scroll down to the section named after your processor (e.g.,
CPU [#0]: Intel Core i7orAMD Ryzen 7). - Look for three specific sensor values:
- CPU Package / Tctl/Tdie: The overall temperature of the processor.
- Core Temperatures (Max): The hottest individual core.
- Thermal Throttling (HTC / PROCHOT): A binary sensor. If this says Yes, your CPU has officially tripped its thermal limiter.
- Scroll further down to the GPU section:
- GPU Temperature: The average core temperature.
- GPU Hot Spot Temperature: The single hottest point on the GPU die. If the delta between the core and hotspot exceeds 20°C–25°C, your thermal paste has pumped out or the cooler mounting pressure is uneven.
2. MSI Afterburner (For Real-Time In-Game Overlay)
If you need to see your temperatures, clock speeds, and frame rates while actively playing without Alt-Tabbing:
- Download and install MSI Afterburner along with the included RivaTuner Statistics Server (RTSS).
- Open MSI Afterburner's Settings (gear icon) and navigate to the Monitoring tab.
- In the graph list, locate CPU Temperature, CPU Clock, GPU Temperature, and GPU Clock.
- Check the box for each sensor, and at the bottom select Show in On-Screen Display.
- Launch your game. You will see a live telemetry overlay in the upper-left corner displaying your exact thermals and frequencies as you play.
How to Confirm Thermal Throttling in Action
High temperature by itself is only half the diagnosis. To prove thermal throttling, you must observe clock speed collapse under load.
Open HWiNFO or MSI Afterburner and launch a demanding gaming session or benchmark. Watch two metrics side-by-side:
- Temperature: Does the CPU reach 95°C–100°C (or the GPU reach 84°C–88°C)?
- Core Clock (Frequencies): Does your processor start at 4,500 MHz, but after five minutes drop to 2,800 MHz or lower while the temperature remains pinned at the maximum limit?
When core clocks drop sharply while temperatures stay pegged at the maximum threshold, thermal throttling is verified. The processor is sacrificing speed to prevent an emergency shutdown.
This frequency instability also introduces significant frame time variance, directly impacting control responsiveness. For competitive titles where timing is critical, this latency penalty is explained in detail in our guide on how to reduce input lag in PC games.
Practical Steps to Fix Thermal Throttling
Once you have verified that your system is overheating, address the underlying cause systematically. Do not begin with complex BIOS tweaks or liquid metal until you have eliminated the basic mechanical bottlenecks.
1. Clear Dust from Heatsinks and Fan Blades
Dust is a thermal insulator. Over 6 to 12 months, dust accumulates inside fin stacks and creates a blanket that prevents cool air from reaching the heatsink metal.
- Desktops: Power off the PC, unplug the power cable, and open the side panel. Use a can of compressed air or an electric air duster to blow dust out of the CPU cooler fins, GPU heatsink, and front intake mesh. Hold the fan blades gently with your finger while blowing air to prevent them from over-spinning and generating reverse voltage into the motherboard headers.
- Laptops: Blow compressed air directly into the exhaust vents on the back and sides, and across the bottom intake slots. If your laptop is more than two years old, opening the bottom cover to gently clean the blower-fan impellers makes a substantial difference.
2. Check Cooler Mounting Pressure and Thermal Paste
Thermal compound dries out over time. If your computer was built more than 3 to 4 years ago, the factory paste may have baked into a brittle, crusty layer that no longer transfers heat efficiently.
- Remove the CPU cooler, clean off the old compound using 99% isopropyl alcohol and a lint-free microfiber cloth, and apply a pea-sized dot of fresh, high-performance thermal paste (such as Arctic MX-4, Noctua NT-H1, or Thermal Grizzly Kryonaut).
- Tighten the cooler mounting screws in a cross pattern (alternating diagonal corners) half a turn at a time until they are snug. Uneven mounting pressure is the most common reason for wild core temperature disparities.
3. Verify Fan Airflow Direction
In custom-built desktops, fan orientation mistakes are surprisingly frequent:
- Intake: Front and bottom fans should blow air into the case.
- Exhaust: Rear and top fans should blow air out of the case.
- If all your fans are oriented as exhaust, your chassis enters negative pressure, choking the cooler and drawing dust through every unsealed seam.
4. Create an Aggressive Fan Curve in BIOS or Software
Modern motherboards often prioritize silent acoustics over thermal performance by default, letting temperatures climb into the 80s before ramping fan speeds.
Enter your motherboard BIOS (press Del or F2 during startup) or open your GPU software (NVIDIA App, AMD Adrenalin, or Fan Control for Windows):
- Set the fan speed to reach 70% at 70°C and 100% at 80°C.
- Running fans faster during heavy gaming maintains thermal equilibrium before heat soaks into the heatsink.
5. Elevate and Level Gaming Laptops
Gaming laptops pull cold air from underneath the chassis and exhaust hot air out the sides and rear. If your laptop is sitting flat on a soft bed, blanket, or wooden desk with low clearance, its intake fans are suffocating.
- Elevate the rear of the laptop by just 1 to 2 inches using a laptop stand, book, or small riser feet.
- Simply lifting the back of a gaming laptop increases airflow clearance and routinely drops CPU and GPU temperatures by 3°C to 7°C without spending any money.
6. Close Heavy Background Applications
Unnecessary background applications keep CPU cores from entering low-power C-states and contribute steady ambient heat. If background software is eating processor cycles and networking bandwidth simultaneously, follow our guide on how to check which programs use your internet and background resources to kill unwanted background tasks before launching your games.
When to Consider Undervolting
If your cooler is clean, your paste is fresh, and your case has adequate airflow, but your hardware still runs hot, undervolting is the most effective modern tuning technique.
Modern processors from both Intel and AMD ship with conservative factory voltage tables to ensure stability across every piece of silicon off the assembly line. In most cases, these factory voltages feed more electrical power than the chip strictly needs to sustain its target frequencies.
- GPU Undervolting: Using MSI Afterburner's curve editor (
Ctrl + F), you can lock your graphics card to run at its standard boost clock (e.g., 1,950 MHz) at a lower core voltage (e.g., 900mV instead of 1,050mV). This routinely cuts GPU power draw by 30 to 50 watts and drops temperatures by 5°C to 10°C with zero loss in gaming frame rate. - CPU Undervolting: On AMD Ryzen systems, enabling Precision Boost Overdrive (PBO) with a negative Curve Optimizer offset (such as -15 to -25 across all cores) lowers operating temperatures while actually allowing the processor to sustain higher boost clocks for longer periods.
The Practical Diagnostic Checklist
Before you invest in expensive new cooling hardware, work through these steps in order:
- Download HWiNFO64 and run the sensor monitor during a 15-minute gaming session.
- Confirm whether Thermal Throttling (PROCHOT) registers a
Yesflag. - Check the GPU Hotspot delta; if it exceeds 25°C above the core, plan a thermal paste replacement.
- Clean accumulated dust from radiator fins and fan impellers.
- Elevate laptop bases or adjust desktop chassis fan curves to reach 100% speed at 80°C.
- Verify that CPU and GPU clock speeds hold steady without sudden frequency drops during extended gameplay.
Keeping thermals under control ensures consistent frame times, eliminates sudden stuttering, and extends the operational lifespan of your hardware.